Johnney Nguyen
Lurker
I been getting myself familiar with the Android Memory Profiler in order to track native C++ memory allocations in my code. I suspected it reported incorrect numbers and so I created a TestApp that leaks memory at 200 mega bytes per frame. Yes its an insane amount, and on my phone, the app will crash after about 30 seconds because the call to allocate memory finally fails.
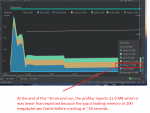
When I watch the Android Memory Profiler track the current memory usage, it doesn't look correct (See attached android_memory_profiler.png). At the end of the 30 second run, it reports 21 megabytes of memory. This is an impossible number considering the amount of memory I was leaking...
Does the android profile track native C++ memory that's used by Android java app itself, so it doesn't take into account my native C++ code I implemented when called via JNI?
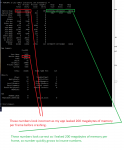
I also ran the same test, but used adb to dump more detailed status using this command (See attached android_memory_dump.png):
"adb shell dumpsys meminfo sanjocorp.com.testmemory"
Under the columns "Pss Total", "Private Dirty", "Private Clean", and "Pss(KB)", the "Native Heap" row reports low numbers similar to the Android Memory Profiler. However, the columns "Heap Size", "Heap Alloc", "Heap Free", seem to report my memory leaks correctly as you can see the memory used report is super high which matches my 200 megabyte leak per frame.
Can someone explain how the Native Heap is tracked for both the Android Memory Profiler and the memory dump as well and what numbers are imported for my native C++ code I implemented?
When I watch the Android Memory Profiler track the current memory usage, it doesn't look correct (See attached android_memory_profiler.png). At the end of the 30 second run, it reports 21 megabytes of memory. This is an impossible number considering the amount of memory I was leaking...
Does the android profile track native C++ memory that's used by Android java app itself, so it doesn't take into account my native C++ code I implemented when called via JNI?
I also ran the same test, but used adb to dump more detailed status using this command (See attached android_memory_dump.png):
"adb shell dumpsys meminfo sanjocorp.com.testmemory"
Under the columns "Pss Total", "Private Dirty", "Private Clean", and "Pss(KB)", the "Native Heap" row reports low numbers similar to the Android Memory Profiler. However, the columns "Heap Size", "Heap Alloc", "Heap Free", seem to report my memory leaks correctly as you can see the memory used report is super high which matches my 200 megabyte leak per frame.
Can someone explain how the Native Heap is tracked for both the Android Memory Profiler and the memory dump as well and what numbers are imported for my native C++ code I implemented?