• After 15+ years, we've made a big change: Android Forums is now Early Bird Club. Learn more here.

SystemPanel: a task killer for people who hate task killers.

I will be using this primarily as a system monitor, but also to force close any misbehaving apps.

exactly what I use it for. Only kill apps when they arent responding.

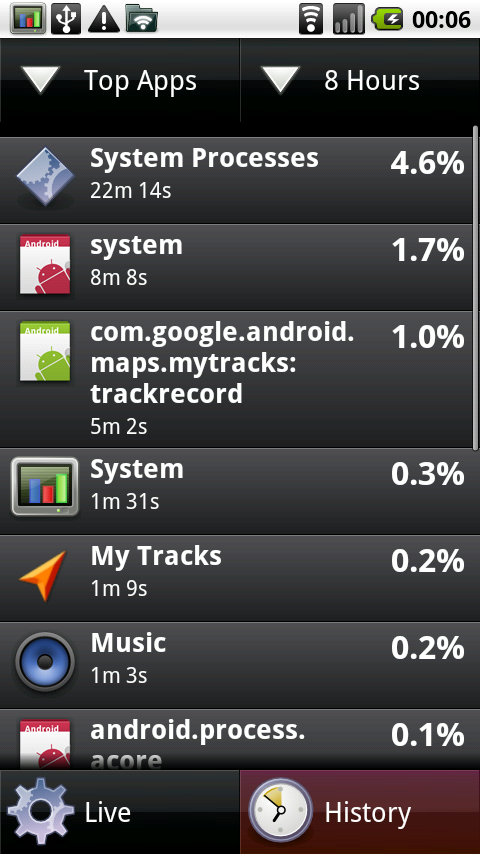
I am trying to work out how to interpret the info given about each app. How do I recognise an app that is hogging resources?

Mainly look at the cpu time. That will tell you what is using the most power.

It then gives a number, e.g. 24.4M - is that 24.4 MB, or what?

thats the amount of memory the app is using. But as you already know, that doesnt mean its using battery, that memory is just cached.

Then there is CPU followed by a time - presumably that is the amount of time it was operative the last time it was used??

I'm not 100% sure, but I think that time is the amount of cpu used since the last time the phone was rebooted.

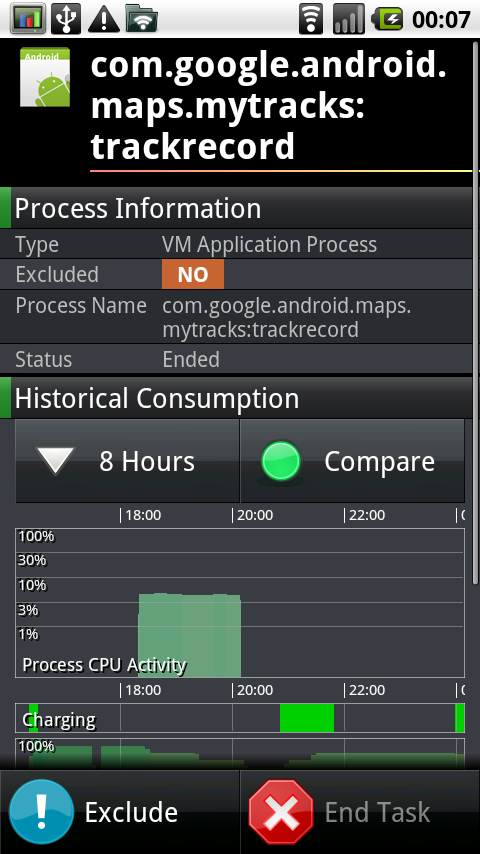
(total CPU time, time since start, average consumption)

Total time is total time used since boot. Time since start is how much time the cpu has been used since the app was loaded into cache.
 
[Posted this over on nextapp.com, thought it wouldn't hurt to post here]

What would make this app complete for me would be the ability to add time based notes, which can be overlaid over any historical graph(s).


Like a lot of folk, most of the use I put SystemPanel to is tuning battery life and tracking down offenders. And of course like most folk, I lose track of everything I've done to try and improve things.


So, for instance, I'd like to make a note that at 4pm on the 11th, I disabled JuiceDefender, and at 11am on the 12th I re-enabled it. Or at 11pm on the 2nd I upgraded to the latest Sprint Lovers ROM. Etc.
The idea being, when I look at my historical graphs, I can get some indication of what I may have done that either improved or hurt battery life.


I'm thinking maybe the 'Charging' line on the historical comparison screen could be used for showing the notes. A little note icon, which brings up a popup showing the text of the note.


The note entry dialog could be off the Menu on the main screen.

Oh, and I'm a +1 for basic status bar icon animation to show CPU. Maybe just animate the existing green, red and blue bars to indicate CPU, memory and network usage. That way I can get rid of my OS Monitor status bar icon, save some real estate.

-- hugh
 
Hello all,

Another maintenance release, 1.0.8 is out. This is simply a roll-up of a few performance improvements and cleanups to the codebase, notably in the installer module (scrollable list of installed applications) and home screen. It also contains a few minor bugfixes.

Hope to have some additional monitored parameters pushed into a 1.1.x release in the not terribly distant future.

Best
--Tod
 
Oh, and I'm a +1 for basic status bar icon animation to show CPU. Maybe just animate the existing green, red and blue bars to indicate CPU, memory and network usage. That way I can get rid of my OS Monitor status bar icon, save some real estate.

+1

This information could alternatively be placed in the message area when the notification window is pulled down. I can easily imaging that it would be less intensive to update some text strings rather than continuously update an icon that is always displayed. You could also get a lot more information in there (add battery percent and state to CPU, memory, and network).
 
1.0.9 is out.

- Plots will now fill the screen on tablets such as the Xoom and Galaxy Tab.
- CPU frequency should be available with more phones/custom ROMs. Please send an email to android@nextapp.com if its not working for you.
- Added a link to the built-in Android task manager's process properties screen (available from the details screen). This only is available in Gingerbread and Honeycomb due to API limitations. It provides a convenient way to manually kill applications that have services which are otherwise unkillable by third party apps as of Android 2.2.
- Second-generation Motorola Droids/Milestones (e.g. Droid X, Droid 2) now have battery use logged in 1% rather than 10% increments.
- The usual bugfixes.

SystemPanel *will* work on dual-core devices such as the Xoom, but it only shows combined CPU usage. I want to break this out and show independent CPU performance in a future release.

EDIT: Lite version of 1.0.9 should be out tomorrow.
 
+1

This information could alternatively be placed in the message area when the notification window is pulled down. I can easily imaging that it would be less intensive to update some text strings rather than continuously update an icon that is always displayed. You could also get a lot more information in there (add battery percent and state to CPU, memory, and network).

I need to look into widget and/or notification bar-based metrics again. The big problem with doing this is major potential battery drain. The Android widget architecture isn't particularly well suited toward providing the ability to push frequent updates *only* when a widget is on screen.
 
SystemPanel *will* work on dual-core devices such as the Xoom, but it only shows combined CPU usage. I want to break this out and show independent CPU performance in a future release.
When do you think you'll have this feature for dual core phones like the Atrix and LG Optimus 2X?
 
I've been using Quick System Info Pro for a few months now. From what I've read here it provides very similar data. Is there anyone out there who has used both and can provide comparison?
 
Good morning all,

1.0.10 is out.

I've recently discovered that a few new Tegra devices such as the LG G2X (stock ROM) are no longer publishing current CPU speed data. The underlying issue is that the "pseudofile" which provides this data is only root-readable. Regrettably the only "fix" was to simply hide the CPU speed bar when such information can't be determined.

The other significant change to 1.0.10 is the addition of a "developer-specific" feature, the ability to forcibly kill processes as root. This feature really is intended exclusively for Android software development...using it in the day-to-day operation of a phone/tablet is a recipe for disaster. As such it has been deliberately made slightly difficult to enable, i.e., you must create a directory containing a specific file (see the "Developer Features" section of the in-app Help). This feature will be available in the free version as well, which will be upgraded to 1.0.10 very soon. As is stated in the docs though, using this feature for anything than software development is STRONGLY discouraged.
 
I've been using Quick System Info Pro for a few months now. From what I've read here it provides very similar data. Is there anyone out there who has used both and can provide comparison?

I use both. System Panel has a much better UI, and the graphs are quite useful (compare app cpu usage, to device usage, to battery life), basically easier to read and better laid out than QSI.

I use both :)
 
Whats the difference between device usage and cpu activity?

I have an infuse, my battery life sucks and when I run the monitor, my device usage is zero during sleep, but the cpu activity is always hovering around 30% according to your app.
 
Whats the difference between device usage and cpu activity?

I have an infuse, my battery life sucks and when I run the monitor, my device usage is zero during sleep, but the cpu activity is always hovering around 30% according to your app.

Device usage is simply screen usage (considering changing it to say this, as this is a common point of confusion).

From the history view, tap the drop down menu in the upper left corner of the screen (It will say "Plot") and change it to "Top Apps". A list of apps will be displayed based on their recent CPU usage. (You can change the interval by using the top-right drop down). What are the top-most apps and what are their CPU usages? You can also tap each app to show its CPU usage over time (and compare it to battery level and overall CPU usage and such).

The top apps view:
HistoricalMetricsTopApps.png


Tapping on an app in the top apps view:
ProcessDetailsTrackRecord1.png


^ The above image shows an app that (legitimately in this case) used a fair amount of CPU over a period of time.
 
Tap "System Processes" and take a look at what's inside. The "System Processes" item is special in that it is the collection of non-application-specific internal Linux processes.
 
Ok. Kr3dh_wq is the system file taking up 10% of the 18. What the hell is that file? Stopping it isn't an option in systempanel.
 
Just googling around a bit for "kr3dh", I believe that's the driver for the accelerometer. My best guess would be that the problem is either an app is listening to accelerometer data when it shouldn't be or the firmware itself has a similar problem. What ROM are you using, and is there any chance an upgrade is available?
 
it just clicked, and i hope this is the problem.

i used 'screen shot it' to take the pic and upload it to show you. i had it set up to screencap on shake. im assuming that the accelerometer is on all the time for that, because it needs to know when im shaking to take a picture. i just uninstalled it and ill check back with you.

thanks for the idea about what that system process is linked to.
The shake to take picture is only an option. Unselect it so that you would need to open up screen shot it before you can take a picture.
 
Hi, I'm a happy user of this app, it looks really slick. I'd just like to ask a couple of questions:

* Is there a way to make the notification icon more faded? It currently uses red and green colors and seems a bit obtrusive to me.

* How much device power consumes the app itself? Does it have any noticeable impact on the battery life?

Thanks,
Borek
 
* How much device power consumes the app itself? Does it have any noticeable impact on the battery life?

Thanks,
Borek
Hi Borek and welcome to AndroidForums. It depends on how often you're using the app. If you're not actively using it to check the other apps usage or killing apps, then battery life drain on it is less than 5%.
 
It depends on how often you're using the app. If you're not actively using it to check the other apps usage or killing apps, then battery life drain on it is less than 5%.

Sorry I should have mentioned that I use the background monitoring feature so I guess it's running all the time.
 
Sorry I should have mentioned that I use the background monitoring feature so I guess it's running all the time.

Sorry for not seeing this and replying earlier. The background monitoring feature doesn't actually run all the time, it fires off approximately every fifteen minutes (approximately because it lets Android try and schedule it next to other events). The data being recorded by SystemPanel (e.g. how many CPU ticks a given process has used) is being constantly tallied by Android itself. SystemPanel simply takes a snapshot of it and timestamps it, which then enables you to plot it over time and see trends. In order to do this, SystemPanel needs to sit in memory all the time, but being in memory and not running doesn't consume any battery life (it takes the same amount of power to store SystemPanel in memory that it does to store random nonsense or zeroes.)

The design spec on SystemPanel is that it should use about 1 minute of CPU time per day for logging.
 
Back
Top Bottom