So I did some extensive testing with Quadrant today. I do now have the advanced version. Where you get the break down of how and what your score is and I've figured out some of the why's.
First, off our score is actually just the average of the 5 respective tests [CPU, Memory, I/O, 2D and 3D]. Now if you have the free version you cannot see your individual test break downs.
So here are 2 of my top scores which I grabbed a ShootMe of:
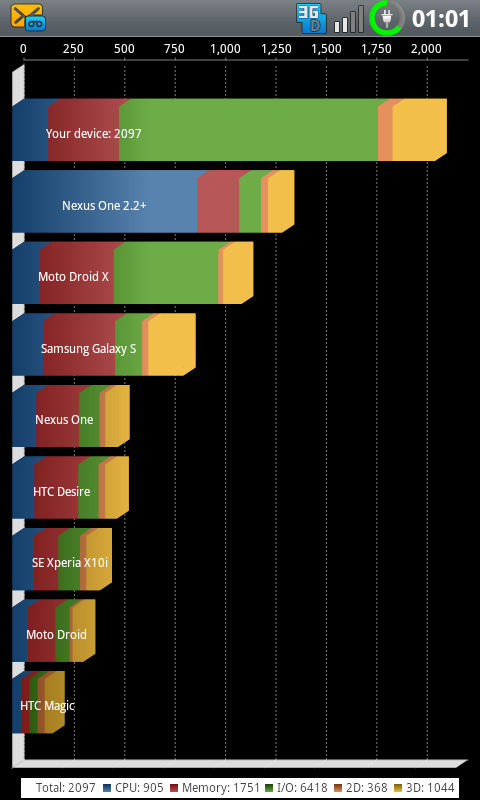

When you add the 5 values and at the bottom and divide by 5 you get the score which is spit out. What is very deceiving about this of course is that each category gets equal weight [1/5 total score] yet because of the numbers I/O is so massively over-rated and something like 2D pales in comparison.
Now here is where I had fun with numbers. I did 25, yes 25 runs thru Quadrant at 1200Mhz [Dirrk's LV DO2 kernel, SetCPU on Performance]. I found some interesting things about each of the 5 individual tests.
1. CPU: In 25 runs I had a low score of 905 and a high of 936. That's right my highest overall score gave me my lowest cpu score. 905-936 is only about a 3% range of variance and it gets even smaller. 20 of my 25 cpu scores were between 924-936. I was going to make a nice chart in excel but quite frankly thats too much work this late on a Sunday night so hopefully I have enough reputation credibility that you will just trust my figures. So with a median/average cpu score in the high 920's lets call it there is about a 1-2% variation on cpu score.
2. Memory: In 25 runs only my highest total score was below 1847; odd huh. Here my range was 1847 to 1920. So again, with a median average in the low 1880's the range of variance here is about 2% from the median point.
3. I/O: Here is where and why we see such large variations in total score average. I had a range of 4048 - 6418 and that is enormous I know. Admittedly, that 4048 was when I received a text during I/O phase of the bench test. So let's even throw that one out. I still had a range of 4977-6418. This score jumped so much and I could not explain the rhyme or reason for it I was just as likely to score 5200 as 6200 and all points in between.
4. 2D: Like cpu score this one barely moved. Again we're talking a 1-2% range of variance. 365-374 was my range here. But out of 25 tests 8 times hit 372, 5 times 373 and 5 times 371. So when I say this one barely moved I mean it.
5. 3D: This one again outside of 2 low ones had a very small variance. Of all 25 tests the range was 942 to 1044. But only twice was my 3D core below 1008. So 23 of 25 were between 1008-1044. So again with a median average in the high 1020's 2% variance.
But I didnt stop there. I wanted to see how linear these figures would be affected by clockspeed. So dropped down to 800Mhz and re tested. I only did 5-6 runs at all subsequent speeds not 25.
So for 800Mhz I found:
1.Cpu: range 641-648; avg. 646
2. Mem: range 1751-1855; avg. 1809
3. I/O: range 3727-4268; this one is hard to avg. I had the two tests in 37xx, the other 4 tests were all 4198-4266
4. 2D: range 263-267
5. 3D: range 1432-1567; this moved a bit more than at 1200Mhz
Think I was done...nope
400Mhz cpu clockspeed
1. CPU: range 332-346
2. Mem: range 1145-1221
3. I/O: range 1968-2090
4. 2D: range 143-145
5. 3D: range 814-868
And believe it or not I ran the test 5 times as well at 200Mhz
1. CPU: range 173-183
2. Mem: range 465-660
3. I/O: range 934-970
4. 2D: range 73-75
5. 3D: range 397-435
Observations:
CPU, 2D and 3D really do have a pretty small degree of variance and as such I was almost able to predict what the scores would be at a given clockspeed. The numbers are not precisely linear but its close and there is a distinct pattern. For every 100% increase in clockspeed there is about a 90% increase in cpu score. So start at 200Mhz, avg cpu score 178, double the speed to 400Mhz and you might think 356 would be the average well not quite its 344 [94% increase]. So 400Mhz is 344, so 800Mhz should be 688, again not quite its 646 [88% increase]. 800 to 1200, so from 646 if it were linear we'd be at 969, not quite its 927-ish [again 88%]. The numbers for 2D were virtually the same in terms of percentages as well. 3D numbers were harder to tie in and if someone wants to crunch the numbers above be my guest.
Memory was/is hard to analyze as a 50% drop in clockspeed did not translate anywhere near a 50% drop, at least not at first. In fact, memory score only dropped about 5% or so going from 1200 to 800Mhz. Now dropping from 800Mhz to 400Mhz there was a much more substantial drop not 50% per se but significant but noticeable like 1/3. Now from 400 to 200 then yes it was almost linear; that is it just about dropped in half just like clockspeed.
I/O. Here's whats interesting while the variation of score is far and away the largest, there is a distinct pattern score-wise and it clearly mirrors cpu clockspeed. So let's start at 200Mhz. I/O averages are about 950-960. Double the clockspeed to 400Mhz, does the I/O double as well... yes it does in fact it more than doubles. 400Mhz average is over 2000. So let's double 400Mhz to 800Mhz, does I/O double? Yup pretty much. Like I said above I had a pair of 37xx scores but also had most of the score in the 4200 range. Finally, 800 to 1200 did we see a 50% increase in I/O scores, not quite, but kinda sorta. I did on numerous occasions crack over 6K but equally true the majority of scores were sub 6K and so here there was not the linear gain we saw at lowers speeds.
Conclusions: We clearly see some established and expected patterns with respect to cpu, 2d and 3d. I/O also has a degree of predictablility based on clockspeed. However, what is underexplained is why there is such a massive variance at the same clock speed. All 4 others test vary only about 2-4% whereas I/O can vary by over 20%. The other obvious conclusion is since Quadrant pumps out the average score of the 5 tests as your score and since Quadrant numbers by themselves exceed the other 4 combined, clearly the key is having a good score there. That's why the previous lag fix was such a booster because it sky-rocketed the I/O score even moreso than voodoo does.
What I'm most curious about is what the guys and gals running the 1250lv are scoring. According to my data and following the fairly linear increases in scores. If I was able to complete the benchmark [which I cannot] I would expect numbers like these:
CPU 960-965+/-
Mem 1900+/-
I/O wow only guessing but 6300-6500 ish [way too much variance to accurately predict]
2D 380-385+/-
3D 1060+/-
So if anyone has Quadrant Advanced and the 1250 kernel I'd love test out my theory versus your actual numbers. Because it seems in reality the 1250 kernel is only scoring the same as the 1200 and I'm trying to search for the why. I wonder if the I/O number is crashing on it, maybe 1250 only gives you 6000 because of stability? Don't know but would love input.
Now how does this extended beyond our SF community? I would say this. If we wanna compare our stuff to other devices lets look at cpu and 3d scores specifically. Let's compare with the same version of Android and then I think we get an idea of where we are at.
Dang Im tried now and I wonder if anything I typed above even makes sense. I hope it does because I've been sitting here an hour typing this shiznit. If it doesn't I'll edit...tomorrow.
First, off our score is actually just the average of the 5 respective tests [CPU, Memory, I/O, 2D and 3D]. Now if you have the free version you cannot see your individual test break downs.
So here are 2 of my top scores which I grabbed a ShootMe of:
When you add the 5 values and at the bottom and divide by 5 you get the score which is spit out. What is very deceiving about this of course is that each category gets equal weight [1/5 total score] yet because of the numbers I/O is so massively over-rated and something like 2D pales in comparison.
Now here is where I had fun with numbers. I did 25, yes 25 runs thru Quadrant at 1200Mhz [Dirrk's LV DO2 kernel, SetCPU on Performance]. I found some interesting things about each of the 5 individual tests.
1. CPU: In 25 runs I had a low score of 905 and a high of 936. That's right my highest overall score gave me my lowest cpu score. 905-936 is only about a 3% range of variance and it gets even smaller. 20 of my 25 cpu scores were between 924-936. I was going to make a nice chart in excel but quite frankly thats too much work this late on a Sunday night so hopefully I have enough reputation credibility that you will just trust my figures. So with a median/average cpu score in the high 920's lets call it there is about a 1-2% variation on cpu score.
2. Memory: In 25 runs only my highest total score was below 1847; odd huh. Here my range was 1847 to 1920. So again, with a median average in the low 1880's the range of variance here is about 2% from the median point.
3. I/O: Here is where and why we see such large variations in total score average. I had a range of 4048 - 6418 and that is enormous I know. Admittedly, that 4048 was when I received a text during I/O phase of the bench test. So let's even throw that one out. I still had a range of 4977-6418. This score jumped so much and I could not explain the rhyme or reason for it I was just as likely to score 5200 as 6200 and all points in between.
4. 2D: Like cpu score this one barely moved. Again we're talking a 1-2% range of variance. 365-374 was my range here. But out of 25 tests 8 times hit 372, 5 times 373 and 5 times 371. So when I say this one barely moved I mean it.
5. 3D: This one again outside of 2 low ones had a very small variance. Of all 25 tests the range was 942 to 1044. But only twice was my 3D core below 1008. So 23 of 25 were between 1008-1044. So again with a median average in the high 1020's 2% variance.
But I didnt stop there. I wanted to see how linear these figures would be affected by clockspeed. So dropped down to 800Mhz and re tested. I only did 5-6 runs at all subsequent speeds not 25.
So for 800Mhz I found:
1.Cpu: range 641-648; avg. 646
2. Mem: range 1751-1855; avg. 1809
3. I/O: range 3727-4268; this one is hard to avg. I had the two tests in 37xx, the other 4 tests were all 4198-4266
4. 2D: range 263-267
5. 3D: range 1432-1567; this moved a bit more than at 1200Mhz
Think I was done...nope
400Mhz cpu clockspeed
1. CPU: range 332-346
2. Mem: range 1145-1221
3. I/O: range 1968-2090
4. 2D: range 143-145
5. 3D: range 814-868
And believe it or not I ran the test 5 times as well at 200Mhz
1. CPU: range 173-183
2. Mem: range 465-660
3. I/O: range 934-970
4. 2D: range 73-75
5. 3D: range 397-435
Observations:
CPU, 2D and 3D really do have a pretty small degree of variance and as such I was almost able to predict what the scores would be at a given clockspeed. The numbers are not precisely linear but its close and there is a distinct pattern. For every 100% increase in clockspeed there is about a 90% increase in cpu score. So start at 200Mhz, avg cpu score 178, double the speed to 400Mhz and you might think 356 would be the average well not quite its 344 [94% increase]. So 400Mhz is 344, so 800Mhz should be 688, again not quite its 646 [88% increase]. 800 to 1200, so from 646 if it were linear we'd be at 969, not quite its 927-ish [again 88%]. The numbers for 2D were virtually the same in terms of percentages as well. 3D numbers were harder to tie in and if someone wants to crunch the numbers above be my guest.
Memory was/is hard to analyze as a 50% drop in clockspeed did not translate anywhere near a 50% drop, at least not at first. In fact, memory score only dropped about 5% or so going from 1200 to 800Mhz. Now dropping from 800Mhz to 400Mhz there was a much more substantial drop not 50% per se but significant but noticeable like 1/3. Now from 400 to 200 then yes it was almost linear; that is it just about dropped in half just like clockspeed.
I/O. Here's whats interesting while the variation of score is far and away the largest, there is a distinct pattern score-wise and it clearly mirrors cpu clockspeed. So let's start at 200Mhz. I/O averages are about 950-960. Double the clockspeed to 400Mhz, does the I/O double as well... yes it does in fact it more than doubles. 400Mhz average is over 2000. So let's double 400Mhz to 800Mhz, does I/O double? Yup pretty much. Like I said above I had a pair of 37xx scores but also had most of the score in the 4200 range. Finally, 800 to 1200 did we see a 50% increase in I/O scores, not quite, but kinda sorta. I did on numerous occasions crack over 6K but equally true the majority of scores were sub 6K and so here there was not the linear gain we saw at lowers speeds.
Conclusions: We clearly see some established and expected patterns with respect to cpu, 2d and 3d. I/O also has a degree of predictablility based on clockspeed. However, what is underexplained is why there is such a massive variance at the same clock speed. All 4 others test vary only about 2-4% whereas I/O can vary by over 20%. The other obvious conclusion is since Quadrant pumps out the average score of the 5 tests as your score and since Quadrant numbers by themselves exceed the other 4 combined, clearly the key is having a good score there. That's why the previous lag fix was such a booster because it sky-rocketed the I/O score even moreso than voodoo does.
What I'm most curious about is what the guys and gals running the 1250lv are scoring. According to my data and following the fairly linear increases in scores. If I was able to complete the benchmark [which I cannot] I would expect numbers like these:
CPU 960-965+/-
Mem 1900+/-
I/O wow only guessing but 6300-6500 ish [way too much variance to accurately predict]
2D 380-385+/-
3D 1060+/-
So if anyone has Quadrant Advanced and the 1250 kernel I'd love test out my theory versus your actual numbers. Because it seems in reality the 1250 kernel is only scoring the same as the 1200 and I'm trying to search for the why. I wonder if the I/O number is crashing on it, maybe 1250 only gives you 6000 because of stability? Don't know but would love input.
Now how does this extended beyond our SF community? I would say this. If we wanna compare our stuff to other devices lets look at cpu and 3d scores specifically. Let's compare with the same version of Android and then I think we get an idea of where we are at.
Dang Im tried now and I wonder if anything I typed above even makes sense. I hope it does because I've been sitting here an hour typing this shiznit.
If it doesn't I'll edit...tomorrow.